The Greens have today called on the Government to adhere to its own planning policies and protect a patch of bushland under threat from development at Shenton Park.
Member for North Metropolitan Region Hon. Alison Xamon MLC said the bushland at the Shenton Park Rehabilitation Hospital site at Lumnos Street formed an important ecological link between Bush Forever sites at Shenton Park and Underwood Avenue bushlands.
She said the larger bushlands in the area linked Kings Park and Bold Park – two of Perth’s most iconic green spaces.
“The Lemnos Street site contains significant portions of Banksia woodland, which was named a Threatened Ecological Community under the Federal Environment Protection and Biodiversity Conservation Act in 2016,” Ms Xamon said.
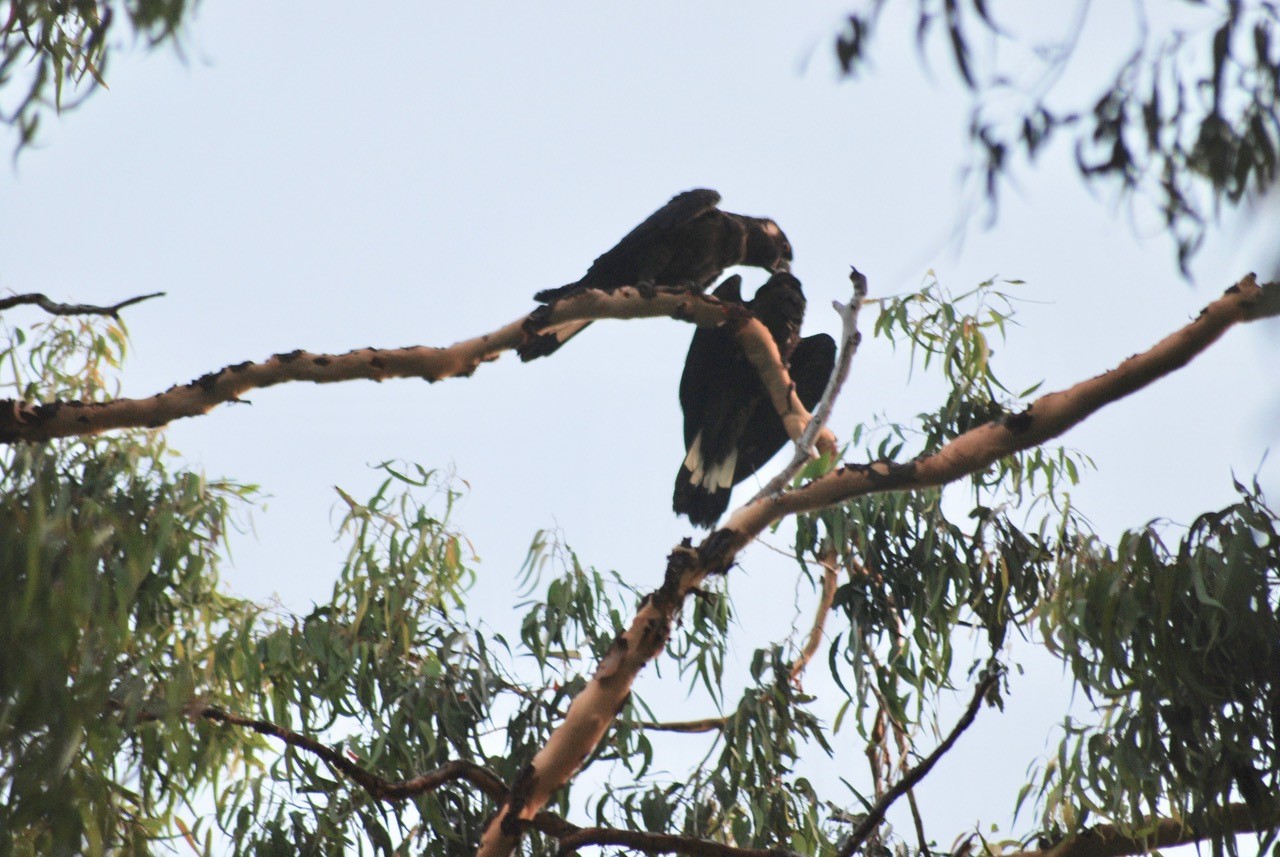
“We know that Banksia woodlands are important feeding ground for vulnerable black cockatoos, which are known to roost at nearby UWA sports grounds and Perry Lakes.”
Ms Xamon said many planning documents recognised the importance of maintaining and enhancing this type of local bushland.
She said it was spelled out specifically in State Planning Policy 2.8, which states that: “proposals or decision-making should “proactively seek to safeguard, enhance and establish ecological linkages between Bush forever areas.”
“I share in the community’s concerns that no attempt has been made to design the Montario Quarter in line with policies, strategies and frameworks around bushland,” Ms Xamon said.
“I ask that the Government adhere to its own policies and retain this important patch of bush in the western suburbs.”
Ms Xamon has today tabled a petition signed by some 300 residents calling on the government to refrain from clearing at the site. She will also deliver a statement in the Legislative Council today.